International ROAS: A Guide to Calculating Your Return on Ad Spend for eCommerce Businesses

Do you know the Return on ad Spend (ROAS) of your eCommerce store’s advertising channels?
Since you’re reading this, you may be struggling to precisely quantify how much revenue your advertising & marketing channels generate.
By the end of this post, you’ll know exactly how to calculate your ROAS, the north star metrics you should be aiming for, and what you can do to maximise returns from your advertising dollars.
What Is ROAS?
ROAS stands for return on ad spend and is a marketing metric that measures how much your business earns in revenue for every dollar spent on advertising.
While ROAS is similar to ROI (return on investment), ROAS looks specifically at the cost of ads versus the overall investment that might be counted in ROI.
If you aren’t tracking ROAS in addition to all your other key marketing metrics, there’s a good chance you aren’t getting the full picture and are making decisions without comprehensive data.
Why Understanding ROAS Is Crucial for Your eCommerce Business
Effective marketing is all about making data-backed decisions. It’s not a guessing game - It’s science.
When marketers talk about metrics like ROI, CTR, response rates, conversion rates, and CPA, they’re doing so to gauge a campaign’s success.
All of these metrics are useful. But if you don’t measure ROAS in addition to all the other metrics, you’re not getting the full picture of how effective your advertising dollars are.
In other words, you don’t have a clear grasp of profitability directly attributed to your advertising campaigns.
Without a clear grasp of your ROAS, it’s impossible to identify and determine which underperforming campaigns you should kill and which winning campaigns you should scale.
As you can imagine, not killing an underperforming campaign early can be an expensive exercise. But on the flip side of that, pausing a campaign too early may give you an incomplete view of its performance.
Over time, as you understand your ROAS across various advertising channels, you’ll be able to set benchmarks and avoid both of the situations described. You’ll also be able to forecast upcoming revenue based on the budget you have for ad spend.
Lastly, ROAS is crucial when you plan to enter a new market as you’ll be able to test its commercial viability quickly by comparing your ROAS across local and international channels. This should result in significantly less ad spend as you won’t be committing resources to scale your cross-border advertising channels before validating that it will work.

How to Calculate ROAS
The equation to calculate your ROAS is simple. Here it is:
The first part of the equation is straightforward. You want to be looking at total revenue attributed to the ad campaign. Now, to get an accurate insight into your campaigns’ effectiveness using ROAS, you need to take all your ad costs into account.
What numbers should you include for the cost of ads?
The ad spend itself will be the largest component of your costs. But there are some less obvious costs that you shouldn’t forget to include, such as:
Agency costs: If you’re outsourcing your advertising to agencies, the fees and commissions should be included in your total ad costs.
In-house salary costs: If you have an ad specialist in-house, you should include personnel costs.
Affiliate Commissions: This should include payouts to affiliates and fees.
Assess how effective your advertising spend is across countries today with your free copy of our International ROAS Calculator.
What Is a Healthy ROAS?
Your ROAS will vary depending on campaign, industry, and marketing goals. That means there is no single ‘acceptable’ ROAS.
Generally, a ROAS of 4:1 is considered healthy - $4 in return for every $1 in ad spend. Of course, this is heavily dependent on your budget, profit margins, and overall business health. But the higher your ROAS, the better.
Some businesses require a much higher ROAS to stay profitable, while others can grow substantially with a lower ROAS (3:1). It’s important to note that ROAS is a short-term metric. It assesses the performance of campaigns that run for a set period (usually a couple of weeks).

When is a lower ROAS acceptable?
There are many instances where a lower ROAS is acceptable.
In the context of international expansion, businesses will often have a lower ROAS.
Why? Because businesses breaking into new markets, have very little brand awareness.
And the average consumer needs to see an ad 20 times before she’s sold, according to Thomas Smith’s Successful Advertising. Repetition was, is, and always will be the key to effective marketing.
When breaking into a new market, chances are you’ll start with a lower ROAS and then move higher as your brand starts to get some traction. It’s difficult to quantify brand awareness, but brand is your most important asset, and you should view your initial campaigns in that light.
How Does ROAS Change When Selling Cross-Border?
As we mentioned, your ROAS from local advertising campaigns will differ from campaigns in other international markets.
Many variables will affect your ROAS in new markets, including:
The competitive landscape in your target market
Foreign currency fees will drive up advertising costs
Click-Through Rates (CTR) will change as demand for products will be different
On-site conversion rates will be impacted by your site’s localized customer experience
Average Order Value (AOV) will change depending on the currency and how it converts over
Lower profit margin from additional international transfer fees when converting revenues back into AUD
For the sake of clarity, let’s assume you’ve found a new target market and have optimized your store for all the above variables.
Chances are, as you begin to ramp up your campaigns, you’ll see a lower ROAS. Initially, it will cost you more to acquire new customers. Ultimately, your international ROAS should come close to parity with your local market for your campaigns to be successful.
Common pay-per-click (PPC) Marketing Channels
When marketers talk about PPC marketing channels, they’re usually referring to Google ads - both the Search and Display networks. But these days, they could also be referring to Facebook ads.
Google Search and Display Network
Google’s search network is where PPC ads appear, above and below the organic search results for any search query. Google’s Display Network (GDN) is where display ads are shown across Gmail, YouTube, Google Finance, and all the websites and apps in the network.
With Google’s Display Network, you have three different pricing options:
CPC: You pay when someone clicks on your ad. This is best for driving traffic to your store’s website.
Cost-per-thousand impressions (CPM): You pay for ad views. This is best for creating a buzz and driving awareness of your brand.
Cost-per-acquisition (CPA): You pay when your ad leads to a conversion. This is best if you want people to take some form of action - whether it’s a purchase or other transaction.
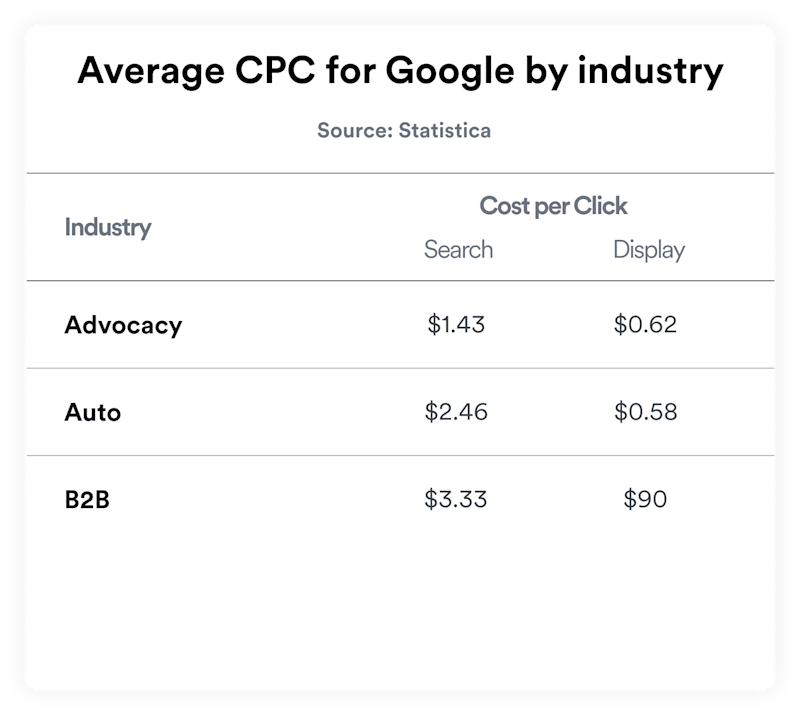
CPCs can vary widely in different industries and from one geographic location to another (even for similar search terms and keywords). Here’s a visual showing the average CPC around on Google by industry:

Facebook and Instagram
As the world’s largest and most widely used social network, Facebook is a massive player in the online advertising world. Favoured by many eCommerce store owners who make a killing on Instagram, it’s not uncommon to find businesses advertising on both Facebook and Google.
Facebook’s pricing model works very similarly to advertising on Google. Facebook does offer advertisers more flexibility with campaign objectives, but the costs can still be broken down into CPCs.
Here are the average CPCs for Facebook by country, with the United Kingdom, Spain, and the United States as the three most expensive CPCs.

Source: AdCostly
Overall, Facebook and Instagram ads perform exceptionally well and offer brilliant ROAS and ROI. Especially for small-medium sized eCommerce businesses that sell niche products. There aren’t many ad platforms that offer a decent return on ad spend for smaller budgets - even $100 can go a long way with Facebook ads.
How Can You Improve Your ROAS and ROI?
To take a holistic view of your eCommerce store’s profitability, you need to be looking at both ROAS and ROI. What exactly is the difference?
As we mentioned, ROAS looks at the return from your ad spend while ROI looks at the return on a particular investment, relative to the cost of the investment; it’s a ratio between your net profit and investment. You need both metrics to understand profitability.
Now, many variables will impact your ROAS, but in general, you can improve it by focusing on these metrics:
Lower your cost per click
Optimise your ad creative by market, leverage customer reviews and make improvements to your targeting (e.g. keywords, audience and geographies)
Increase your website conversion rate
Localise and optimise your online store (e.g. localised products, promotions, languages, currencies, payment methods and shipping options)
Increase your average order value
Leverage bundling, discounting or upselling in each market (e.g. FREE international shipping for orders over $XX)
Boost your profit margin
Minimise your international fulfilment and overhead costs (e.g. using Airwallex to save 3 - 5% of international payment fees on supplier payments or card transactions)
Improve Your ROAS With Airwallex
We’ve covered how you can calculate your ROAS, common PPC channels, and how you can improve your ROAS when selling cross-border.
The bottom line to improving your ROAS and your business's bottom line?
Optimize all facets of your eCommerce store for international expansion to minimize costs and increase profitability across your advertising channels.
With Airwallex, you can reduce costs on international ad spend with virtual cards and improve your overall profit margins with Foreign Currency Accounts and FX when making international money transfers.
Ready to start saving on your international marketing spend? Get started with your Airwallex global business account and virtual Visa debit cards today.
Related article: How to Calculate ROI

Share
View this article in another region:Global
Related Posts

WorldRemit Account Review (2025): Features and fees
•4 minutes

BIN sponsorship | How it can help your business
•9 minutes